How
do
I
interpret
the tables?
|
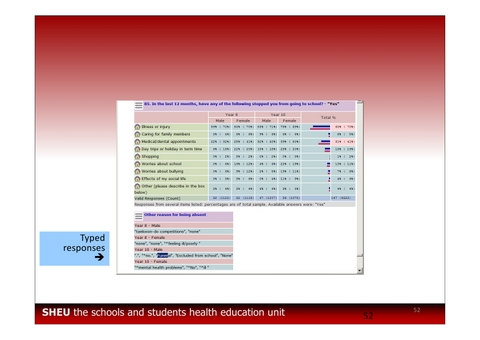
The table for each question shows all the
responses, the percentages giving each response (first
giving the breakdown selected, and then an overall
percentage for each response) with a little set of blue bars
to illustrate.
If you chose a comparison sample, these results will be
shown in brackets beside your results, and the overall
percentages for the comparison sample will be shown as pink
bars.
|
 |